Showing posts with label vscode. Show all posts

How to run dbt on Docker


How to configure a local dbt development environment for free

In this article, we will learn how to configure a local dbt development environment with the free dbt-core. In this context, we will use the free and open-source relational database management system PostgreSQL and Visual Studio Code as our IDE.


Why choose dbt?

dbt is a popular data transformation framework because anyone familiar with SQL can safely use it, and it supports multiple adapters including Databricks, PostgreSQL and Snowflake among others.

Unlike many alternative data transformation frameworks such as Matillion or Coalesce, which are low-code and GUI oriented, dbt is a code-first framework SQL focused. This means that you can write code using your favorite editor and run it against any database, or even easily migrate away from dbt to another tool.

dbt is available in 3 products: core, fusion and cloud. dbt core is a free and open-source framework, fusion provides additional features and cloud provides a hosted service. In this article, we will focus on dbt core.

Why use Docker?

Docker is a platform that allows to run applications in virtualized containers, providing safely isolated environments, infrastructure-agnostic deployments and portability.

Whether you are developing an application for personal use or business-critical solution for enterprise, technologies evolve and change, and Docker provides a way to test your code against different versions of software, libraries and frameworks.

What you will need?

  • Docker Desktop
  • Visual Studio Code
  • Local folder for your project files, including dbt models and PostgreSQL database

How to install and configure dbt-core and dbt-postgres with Docker?

  1. Download and install Docker Desktop https://www.docker.com/products/docker-desktop/

  2. Launch Docker Desktop.

  3. Launch Visual Studio Code and open your project folder.

  4. For PostgreSQL, we will download from existing Docker image.

    1. In Visual Studio Code, open a terminal window.

    2. Pull a PostgreSQL Docker image by running this command in the terminal:

      docker pull postgres:13
      

      Here you can specify another PostgreSQL version or "latest" if you prefer, but it is recommended to always target a version.

  5. For dbt, we will build our image with dbt-core and dbt-postgres from existing Python Docker image.

    1. Create a new file named Dockerfile in your project folder.

    2. Add the following content into the file:

      FROM python:3.13-slim
      
      # Install system dependencies including git
      RUN apt-get update && apt-get install -y \
          gcc \
          g++ \
          postgresql-client \
          libpq-dev \
          python3-dev \
          build-essential \
          git \
          && rm -rf /var/lib/apt/lists/*
      
      # Install dbt packages
      RUN pip install --no-cache-dir \
          dbt-core \
          dbt-postgres
      
      WORKDIR /usr/app
      
      CMD ["bash"]
      

      Again, you can choose a different version of Python. To see the available list of Python Docker images, visit this link https://hub.docker.com/_/python/

    3. Build the dbt image by running this command in the terminal:

      docker build -t dbt-image .
      

      If you are running on an ARM64 architecture, you need to add the --platform linux/amd64 flag to the build command, because dbt-postgres does not support that architecture.

      docker build --platform linux/amd64 -t dbt-image .
      
  6. Open Docker Desktop and look under "Images", you will see both images "postgres" and "dbt-image".

  7. Create your dbt profile configuration which will be used by dbt-core.

    1. Create a new file named .dbt/profiles.yml in your user home directory. On Windows, this is typically C:\Users\your_username\.dbt\profiles.yml.

    2. Add the following content into the file:

      your_dbt_project_name:
        outputs:
          dev:
            dbname: your_postgres_db_name
            host: postgres  # This is the service name in docker-compose
            password: your-postgres-password
            port: 5432
            schema: your_schema_name
            threads: 1
            type: postgres
            user: your-postgres-user
        target: dev
      

      Replace all the placeholders with your actual names and credentials.

  8. Create an environment file to declare credentials for your project.

    1. Create a file named .env in your project directory.

    2. Add the following content into the file:

      POSTGRES_DB=your_postgres_db_name
      POSTGRES_USER=your-postgres-user
      POSTGRES_PASSWORD=your-postgres-password
      

      Replace all the placeholders with your actual credentials.

  9. Create the containers to run the images for your project.

    1. Create a new file named docker-compose.yml in your project folder.

    2. Add the following content into the file:

      services:
        dbt:
          image: dbt-image  # Use your built dbt image
          volumes:
            - .:/usr/app
            - ${USERPROFILE}/.dbt:/root/.dbt  # Windows-friendly path
          working_dir: /usr/app
          depends_on:
            - postgres
          networks:
            - dbt-network
          stdin_open: true
          tty: true
      
        postgres:
          image: postgres:13  # Use your postgres image
          environment:
            - POSTGRES_DB=${POSTGRES_DB}
            - POSTGRES_USER=${POSTGRES_USER}
            - POSTGRES_PASSWORD=${POSTGRES_PASSWORD}
          ports:
            - "5432:5432"
          volumes:
            - postgres_data:/var/lib/postgresql/data
          networks:
            - dbt-network
      
      volumes:
        postgres_data:
      
      networks:
        dbt-network:
          driver: bridge
      
    3. Start the container by running this command in the terminal:

      docker compose up -d
      

      Confirm the container is running by running this command in the terminal, or simply looking at the list of containers on Docker Desktop:

      docker ps
      

      To stop the containers from running, run this command in the terminal:

      docker compose down
      

      Since the container has now been added to Docker Desktop, you can also start and stop the containers from there.

  10. Install the Visual Studio Code extension to manage your containers.

    1. Search for "Microsoft Dev Container" in the Visual Studio Code extensions marketplace, then install it.

    2. Open the "Containers" extension to see the list of containers through this extension, make sure Docker Engine is running.

    3. Right-click on your container to start it.

  11. We will now use dbt to initialize your project.

    1. Right-click on your "dbt-image" container and select "Attach Shell".

    2. From the terminal, run dbt init to initialize your project. dbt-core will add folders and files to your project. A sample of models will be created in your project.

      • Make sure your dbt_project.yml profile setting is mapped to the profile defined in your profiles.yml file.
        # This setting configures which "profile" dbt uses for this project.
        profile: 'your_dbt_project_name'
        
    3. Run dbt debug to check your connection.

    4. Run dbt build to materialize your models into tables on your PostgreSQL instance.

That's it, you have now created your dbt project and build your models into your database instance, all running in a Docker container.

How to run free LLM chat agent on VSCode?


Unleash the power of LLM agent on Visual Studio Code for personal use

With the advancement of LLM agents they've become an essential tool for developers to help debug and document code, and also to assist in design, build and review data solutions.

Visual Studio Code (VSCode) is a popular code editor that has gained popularity among developers due to its simplicity and ease of use. It easily integrates GitHub Copilot which is widely used by enterprise developers. However, quota limits the number of requests they can make to the LLM agents on the free tier. Individual developers may not want to commit to a paid subscription or may wish to consider alternatives.

In this article, we will explore how to run free LLM agents in VSCode.


What are the avaiable cloud LLM gateways for VSCode?

Multiple cloud LLM gateway platforms are available. Some of them are:

They all provide access to multiple LLM models, with some free tier options. VSCode developers can integrate any of them into their environment using the extension Continue published by continue.dev.

What about self hosting open source LLM locally?

Self hosting LLM locally is a great option for developers who want to run their own LLM agents or are concerned about data privacy. This prevents data from being sent to third parties. However, the most powerfull models requires significant computational resources and may not be suitable for everyone. In addition to powerful GPU, available memory is also a limiting factor.

A popular tool for self hosting LLM locally is Ollama, which can be directly installed on your computer or through a Docker image.

Some models will offer a variant specialized for development which may be more suitable for your needs.

How to install and configure VSCode Continue extension?

  1. Download and install VSCode https://code.visualstudio.com/Download

    • Consider turning-off telemetry settings.
  2. Search and install the extension Continue published by continue.dev

  3. To set up a cloud LLM gateway:

    1. Create your account on the cloud platform and get your API key.

    2. Configure the LLM models in the file ~/.continue/config.json which replaces config.yml (you can safely deleted the YAML file):

      {
        "models": [
          {
            "title": "your model name",
            "provider": "your provider name",
            "model": "provider-model-name",
            "apiBase": "provider-api-base-url",
            "apiKey": "your-provier-api-key",
            "toolChoice": "auto",
          },
      }
      

      The reason for using the JSON configuration file instead of YAML is that the JSON config allows more needed to be set.

      A more concrete example using Qwen3 specialized Coder model on OpenRouter:

      {
        "models": [
          {
            "title": "Qwen3-Coder-480B (OpenRouter - Free)",
            "provider": "openai",
            "model": "qwen/qwen3-coder:free",
            "apiBase": "https://openrouter.ai/api/v1",
            "apiKey": "your-openrouter-api-key",
            "contextLength": 16384,
            "toolChoice": "auto",
            "completionOptions": {
              "temperature": 0.15,
              "maxTokens": 4096
            }
          },
      }
      

      Note that settings such as "contextLength", "temperature" and "maxTokens" varie between models and providers, and can be adjusted.

    3. Reload VSCode using the command Ctrl+Shift+P and select "Developer: Reload Window", then select Continue to display the chat option. If you have configured multiple models, you can select the model you want to use from the dropdown menu.

  4. If you are self-hosting a LLM model:

    1. Download and install Docker https://www.docker.com/products/docker-desktop/

    2. Start Docker Desktop and open a terminal.

    3. Download and install Ollama, for computers without GPU, run the following command:

      docker pull ollama/ollama
      

      If your computer have a GPU, the installation procedure differ depending on your GPU manufacturer. Refer to these instructions https://docs.ollama.com/docker

    4. Start Ollama on Docker, you can give your container a different name:

      docker run -d --name ollama-container -p 11434:11434 -v ollama:/root/.ollama ollama/ollama
      
    5. Download and install a LLM model on your Ollama container, for a list of available models, see https://ollama.com/library?sort=popular

      For example, to download Qwen 2.5 specialized Coder 1.5b:

      docker exec -it ollama-container ollama pull qwen2.5-coder:1.5b
      

      You must specify the model name exactly as listed on the page. Larger ##b versions are more powerful but require more memory. Start with the smaller and upgrade later if your computer has enough memory.

    6. Verify the model is installed in your Docker container:

      docker exec -it ollama-container ollama list
      
    7. Test the model prompt directly to ensure it works (just say "hello"):

      docker exec -it ollama-container ollama run qwen2.5-coder:1.5b
      
    8. Optionnally, you can install the Docker extension for VSCode to manage your Docker containers.

    9. Add the local LLM model to the file ~/.continue/config.json:

      {
        "models": [
          {
            "title": "Qwen2.5-Coder-1.5b (Chat)",
            "provider": "ollama",
            "model": "qwen2.5-coder:1.5b",
            "toolChoice": "auto",
            "contextLength": 8192,
            "maxTokens": 4096
          },
      }
      

      Specify lower context length reduces resource usage and improve response time. You can progressively increase context length to improve accuracy if your computer performance allows it.

      For example, if you configured both cloud and local Qwen models, your configuration file should look like this:

      {
        "models": [
          {
            "title": "Qwen3-Coder-480B (OpenRouter - Free)",
            "provider": "openai",
            "model": "qwen/qwen3-coder:free",
            "apiBase": "https://openrouter.ai/api/v1",
            "apiKey": "your-openrouter-api-key",
            "contextLength": 16384,
            "toolChoice": "auto",
            "completionOptions": {
              "temperature": 0.15,
              "maxTokens": 4096
            }
          },
          {
            "title": "Qwen2.5-Coder-1.5b (Chat)",
            "provider": "ollama",
            "model": "qwen2.5-coder:1.5b",
            "toolChoice": "auto",
            "contextLength": 8192,
            "maxTokens": 4096
          },
      }
      
    10. Open the Continue chat on VSCode and start interacting with the model. When using the local LLM, always start your Docker container before.

Tip: by default, the Continue extension opens on the left side of the editor, you can drag the Continue icon to the Chat panel to move it to the right side, and switch between GitHub Copilot chat and Continue chat.

You are all set now, enjoy the power of free LLM models on Visual Studio Code.

Are there other alternatives to GitHub Copilot and Continue?

Yes, some LLM models inclure their own VSCode extension. Amongst the free options, Qwen is avaiable through the extension Qoder (formerly Lingma). Configuration is easier as long you have an account on their platform.

Visualize Covid-19 on Python Notebook

Create your first Python notebook to analyze the Covid-19


The Covid-19 pandemic shocked our entire world but also brought interest in data science and predictive analytics. John Hopkins University of Medicine led the field by compiling and releasing worldwide cases statistics on their well-known dashboard. It was an opportunity for myself to explore Python and its capabilities for data wrangling and data visualization on Covid-19 data when it became pandemic. In this article, I will share my beginner experience and walk you through how to create your first Python chart.


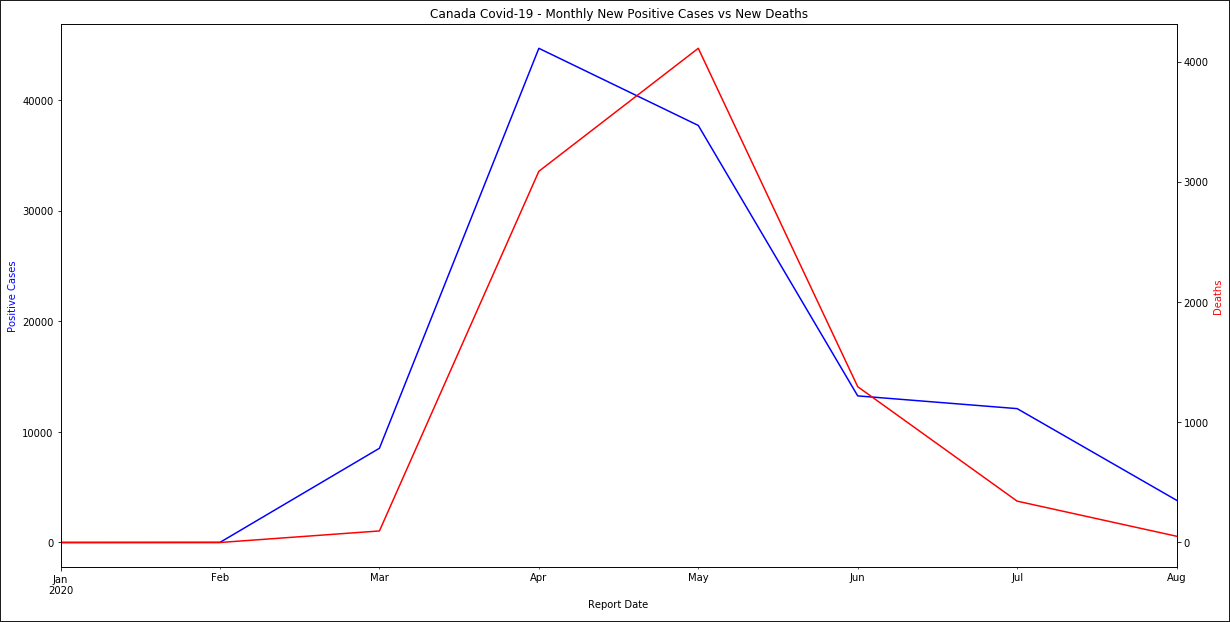
Canada Covid-19 Monthly New Cases and Deaths


Install Visual Studio Code, Python and Jupyter Notebook support


Microsoft Azure Notebooks preview has been available for free, unfortunately it will be retired on October 9th, 2020. It did provide a great web-based platform to develop IPython-style Notebook worry-free of software installation and configuration. Instead, I strongly recommend to use Microsoft Visual Studio Code, a powerful open-source code editor with wide-range of extensions. It is available for Windows, Linux and Mac OS, with built-in support for Source Control Management (SCM) Git.


  1. Visit https://code.visualstudio.com/ to download Visual Studio Code.

  2. Launch Visual Studio Code.

  3. In Extensions, search for Python; install the extension published by Microsoft, it includes support for Jupyter Notebook.

  4. You may need to restart the editor.


Get your Covid-19 data source


Several data sources on Covid-19 are available on GitHub, however I prefer the files shared by Tableau Software on Data.World. I find their CSV file easier to work with and though their data is updated daily only, this frequency is sufficient for our Python project.


Their data is sourced from The New York Times, the European Centre for Disease Prevention and Control, and the Public Health Agency of Canada. Not all countries' data may be included.


  1. Visit https://data.world to create your account.

  2. Go to this page https://data.world/covid-19-data-resource-hub/covid-19-case-counts.

  3. On the file COVID-19 Activity.csv, click the Download button, then select Share URL.

  4. Copy the link, it will be used to retrieve the data in your Python notebook.


Feel free to explore the file using Data.World viewer to get yourself familiar with the columns and data format of the file. The site also provides a convenient online querying tool to browse the data file.


Design your Python Notebook on Visual Studio Code


In Visual Studio Code, start a new Jupyter Notebook; use the command Ctrl+Shift+P then type Python: Create New Blank Jupyter Notebook to open a new .ipynb file.


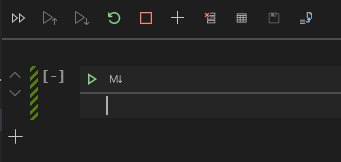
Jupyter Notebook on Visual Studio Code


The box where the cursor is located is called a Cell. Notebooks support two types of cells: Code and Markdown. To toggle a Cell between the two types, click on .


Code cells are for Python coding, while Markdown is a lightweight markup language for text formatting. Markdown is commonly used as .md extension files across SCM platforms like Git or GitHub. Markdown cells are convenient to present and describe the results of your Notebook.


Markdown language syntax and rendered output


Markdown cells will be automatically rendered when you leave the cell. On Code cells, click on to execute the code. New Cell is added for you, but you can insert a new Cell by clicking on the + button.


Enter the code below into your Code cell, replacing the URL you copied from Data.World. This script imports the popular pandas library and stores the CSV content into a Data Frame, Python’s grid data store structure for easy manipulation.


# Import pandas library.

import pandas as pd


# Define the columns to keep.

columns = ['REPORT_DATE', 'COUNTRY_SHORT_NAME', 'PROVINCE_STATE_NAME', 'PEOPLE_POSITIVE_CASES_COUNT', 'PEOPLE_DEATH_COUNT']


# Retrieve CSV file into Data Frame.

df = pd.read_csv('https://query.data.world/YOUR-OWN-URL', parse_dates=True, skipinitialspace=True, usecols=columns)


# Filter on Canada data only and store in another Data Frame.

canada = df.query('COUNTRY_SHORT_NAME=="Canada"')


# Explicitly format REPORT_DATE column to datetime.

canada['REPORT_DATE'] = pd.to_datetime(canada['REPORT_DATE'])


# Fill NaN count with 0.

canada['PEOPLE_POSITIVE_CASES_COUNT'].fillna(0, inplace=True)


# Display top 5 rows.

canada.head()


Execute the Cell; an asterix [*] on the left of the Cell indicates the code is being executed. A sequential number will appear when it has completed, indicating how many cell runs completed so far within your Notebook. The output is shown below.


Rendering a Data Frame to a graphical chart is fairly simple in Python. However, we need to pivot the province and territories into columns, then the plot() method can easily produce the line chart. Run the code below in a new Cell.


# Pivot the Province and Territories into columns and store into another Data Frame.

cases = canada.pivot(columns='PROVINCE_STATE_NAME', index='REPORT_DATE', values='PEOPLE_POSITIVE_CASES_COUNT')


# Plot the pivoted Data Frame into chart, lines by default.

cases.plot(figsize=(20, 10), title='Canada Covid-19 Cases')


This will produce a multiple lines chart by province and territories for Canada Covid-19 cases. You may need to click the Run button a second time to see the actual chart.


Canada Covid-19 positive cases by province and territory timeline


Due to the huge population discrepancy between provinces and territories, this chart is not particularly interesting. Also there was no real data prior to March 2020. Let’s apply an additional filter and group some provinces and territories. Enter the following code in a new Cell then execute.


# Ignore data prior to March 2020.

groupCases = cases.query('REPORT_DATE >= "2020-03-01"')


# Group Maritimes Provinces

maritimes = ['New Brunswick', 'Newfoundland and Labrador', 'Nova Scotia', 'Prince Edward Island']

groupCases['Maritimes'] = groupCases[maritimes].sum(axis=1)

groupCases = groupCases.drop(maritimes, axis=1)


# Group Western Central Provinces

westCentral = ['Manitoba', 'Saskatchewan']

groupCases['West Central'] = groupCases[westCentral].sum(axis=1)

groupCases = groupCases.drop(westCentral, axis=1)


# Group Northern Territories

territories = ['Northwest Territories', 'Nunavut', 'Yukon']

groupCases['Territories'] = groupCases[territories].sum(axis=1)

groupCases = groupCases.drop(territories, axis=1)


groupCases.head()


The resulting Data Frame has grouped some provinces and territories together. We also filtered out rows prior to March 2020.


Add a new Cell then generate the chart with the grouped cases.


# Plot the grouped Data Frame into chart, lines by default.

groupCases.plot(figsize=(20, 10), title='Canada Covid-19 Cases')


The new lines chart with grouped provinces and territories looks like below example.


Canada Covid-19 positive cases timeline


Python Data Frame includes many useful methods. Next we want to visualize the latest total deaths count. To do so, we find the last REPORT_DATE to filter the data on. Run the code below.


# Get latest REPORT_DATE available.

maxDate = canada['REPORT_DATE'].max()


# Filter on latest REPORT_DATE and store in another Data Frame.

deaths = canada.query('REPORT_DATE==@maxDate')


# Fill NaN count with 0.

deaths['PEOPLE_DEATH_COUNT'].fillna(0, inplace=True)


# Display top 5 rows.

deaths.head()


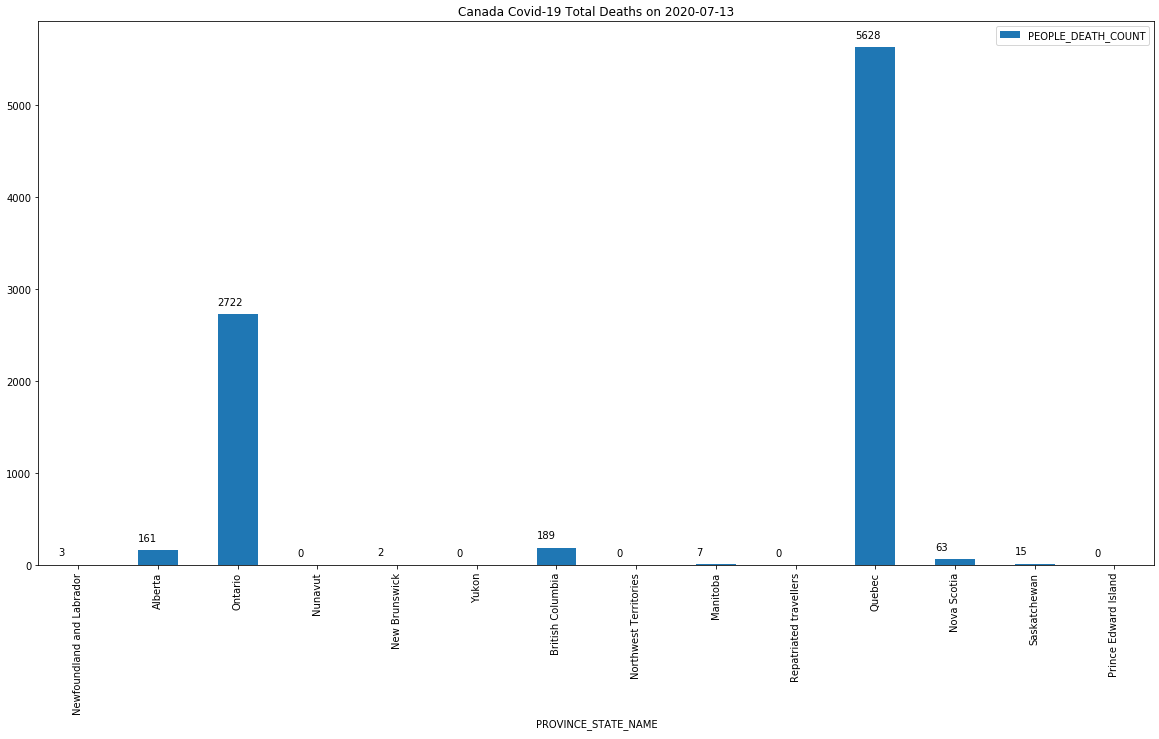
For this data visualization, we plot into bar charts and add the formatted date. To display the value of each bar on the chart, use annotate() along with patches to get the coordinates of the bars. On a new cell, input then execute this code.


# Visualize total deaths by province and territory with formatted date.

ax = deaths.plot.bar(x='PROVINCE_STATE_NAME', y='PEOPLE_DEATH_COUNT', title='Canada Covid-19 Total Deaths on ' + maxDate.strftime("%Y-%m-%d"), figsize=(20, 10))


# Display count value atop each bar, offset the top position by 100.

for p in ax.patches:

    ax.annotate(str(p.get_height()), (p.get_x(), p.get_height() + 100))


The execution produces a bar chart of the total Covid-19 deaths by province and territories, with the total count value atop each bar.


Canada Covid-19 total death count by province and territory


As you can see, Python on Jupyter Notebook is a powerful language and tool to easily wrangle and visualize data. By adding Markdown cells, you can integrate detailed analysis or explanation of the output results. IPython-style Notebook is also used on Databricks, a Spark-based distributed computing data platform available on Azure. Did this exercise help you a quick start into Python? Let me know.


- Eric Chan


Related links


John Hopkins University of Medicine Coronavirus Resource Center

https://coronavirus.jhu.edu/map.html


Coronavirus (Covid-19) Data Hub

https://data.world/covid-19-data-resource-hub


Azure Notebook

https://notebooks.azure.com/


Visual Studio Code

https://code.visualstudio.com/


How to run dbt on Docker

  How to configure a local dbt development environment for free In this article, we will learn how to configure a local dbt development envi...